Normative Connectomes
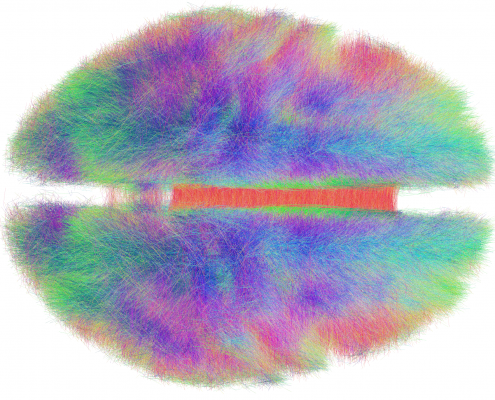
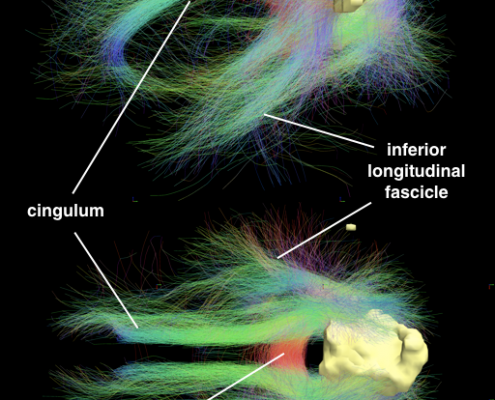
Since 2014, we worked on estimating “average wiring diagrams” of the human brain. Based on diffusion-weighted or resting-state functional MRI data of large cohorts of subjects/patients, this line of work focused on running whole-brain tractography or functional connectivity analyses, warping individual connectomes into standard space and then averaging the results across the group of subjects.
In 2014, we published a first article under the lead of Felix Blankenburg describing the effort of a first structural-functional MNI connectome. There is a small additional article associated with the data release of this first connectome. 2016, we replicated results based on a much larger cohort of healthy subjects and validated the use of such normative connectomes by replicating multiple connectomic studies directly within template space and based on the group connectome only.
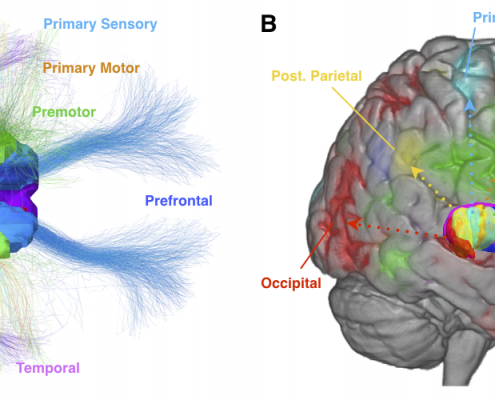
In 2017, a first article under the lead of Andrea A Kühn made use of such normative connectomes by combining connectivity measures with electrophysiological recordings of the subcortex. This novel connectome in use here was based on high-quality multishell diffusion data acquired within the human connectome project (Setsompop 2013).
A second article published under the lead of Michael D Fox explored connectivity profiles of literature based deep brain stimulation targets using normative connectomes. This made use of a 1000-healthy subject functional connectome based on data off the Harvard genomic superstruct project that is also used on neurosynth.org and was both preprocessed and provided by Thomas Yeo (Yeo 2011).
Finally, within work of a third article, both functional and structural average connectomes from patients suffering from Parkinson’s Disease were created (using data of the PPMI project; ppmi-info.org).
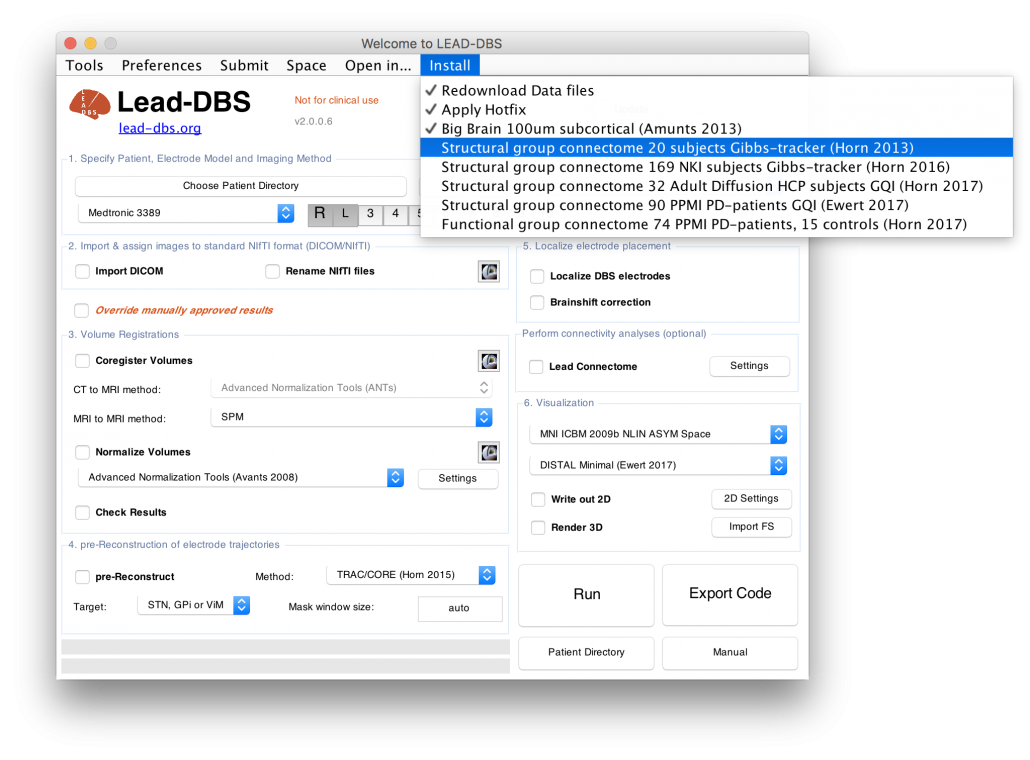
Most normative connectomes are available for direct download within the Lead Neuroimaging Suite (leadsuite.io)
List of currently available connectomes
- Structural normative connectomes
- Structural group connectome of 19 subjects [Gibbs-tracker] (Horn 2013)
[Direct download current version v1.0] - Structural group connectome of 169 NKI-RS subjects [Gibbs-tracker] (Horn 2016)
[Direct download current version v1.0; Download via NITRC] - Structural group connectome of 32 Adult Diffusion MGH-USC HCP subjects [GQI fiber tracking] (Dataset: Setsompop 2013; processing: Horn 2017)
[Direct download current version v1.2; older versions: v1.1, v1.0] - Structural group connectome of 85 PPMI PD-patients [GQI fiber tracking] (Dataset: Marek 2011; processing: Ewert 2017)
[Direct download current version v1.1; older versions: v1.0] - Structural group connectome of 985 HCP subjects [GQI fiber tracking]: dTOR-985 (Elias 2024)
[ Half version; Quarter version; Scripts and datasets on FigShare]
- Structural group connectome of 19 subjects [Gibbs-tracker] (Horn 2013)
- Functional normative connectomes
- Resting-state functional group connectome of 1000 GSP healthy subjects, can be directly used for network mapping within Lead-DBS (Lead Mapper and NetworkMapping Explorer), preprocessed by Bassam Al-Fatly (Cohen 2023). Install: search and download all *.tar files from Harvard Dataverse, extract them, then download the connectome meta data and extract the three files into the same connectome folder.
- Resting-state functional group connectome of 74 PPMI PD-patients, 15 controls (Dataset: Marek 2011; processing: Horn 2017)
[Direct download current version v1.0] - Resting-state functional group connectome of 75 Toronto PD-patients (Detailed description: Zenodo; processing: Horn 2017)
[Direct download current version v1.0] -
Resting-state functional group connectome of 100 typically developing children (6-18 yrs) assembled from NYU 2 sub-cohort of the Consortium for Reliability and Reproducibility. The raw data was preprocessed using a set of multiple neuroimaging pipelines (SPM, FSL and Lead-DBS). The timeseries were normalized to the pediatric MNI space and integrated in Lead-DBS as a ready-to-read timeseries matrices using Lead-Connectome Mapper. The connectome is suitable to use with data normalized to the aforementioned pediatric space. For further details, please refer to Al-Fatly 2023. [Direct download]
Applications
Normative connectomes cannot replace patient/subject-specific connectivity information but are useful in scenarios where subject-specific data is not available and cannot be acquired. This often includes clinical applications such as:
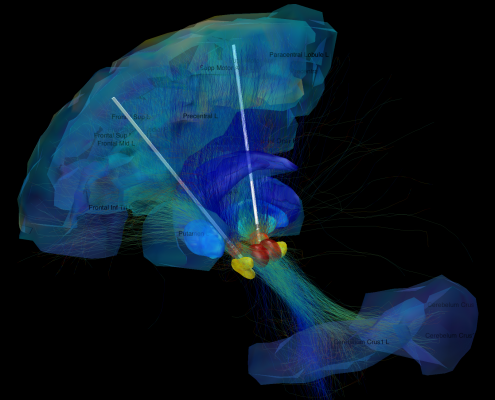
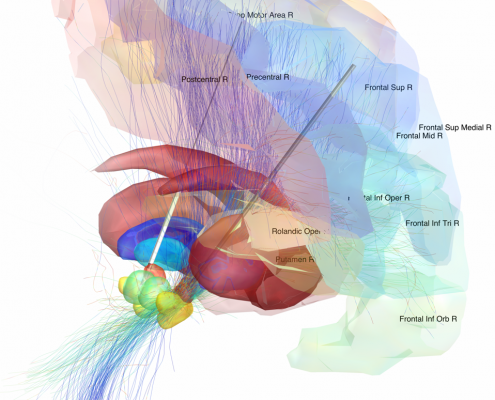
- Deep Brain Stimulation: After surgery, patients cannot be scanned in the MRI without restrictions, acquiring high quality data is difficult if not impossible (e.g. Horn 2017a,b,c).
- Other forms of Brain Stimulation: Similar concepts may apply to noninvasive brain stimulation such as TMS (e.g. Weigand 2017)
- Stroke: After stroke, patients can undergo MRI scans, but their brain structure is modified by the stroke event. If researchers are interested in how connectivity was before the stroke event, normative connectomes may at least give a useful hint (e.g. Boes 2015, Laganiere 2016, Fischer 2016, Darby 2016 & 2017, Fasano 2017)
- Analysing large databases: It is often difficult if not impossible to acquire connectivity data from large cohorts of patients/subjects that are analysed retrospectively. Still, such databases can sometimes yield highly valuable information and the combination with normative connectomes can yield further information (e.g. Horn 2017a).

